MPAndroidChart開源圖表庫之餅狀圖
為大家介紹一款圖標開源庫MPAndroidChart,它不僅可以在Android設(shè)備上繪制各種統(tǒng)計圖表,而且可以對圖表進行拖動和縮放操作,用起來非常靈活。MPAndroidChart同樣擁有常用的圖表類型:線型圖、餅圖、柱狀圖和散點圖。
mpandroidchartlibrary.jar包下載地址:
https://github.com/PhilJay/MPAndroidChart/releases
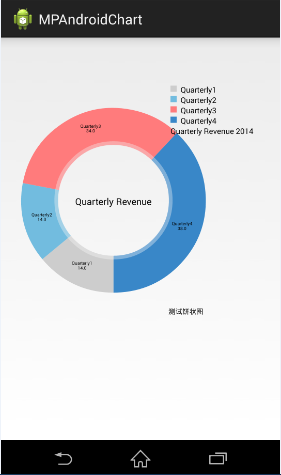
下面主要實現(xiàn)以下餅狀圖:
1.從上面的地址中下載最新mpandroidchartlibrary-2-0-8.jar包, 然后copy到項目的libs中
2. 定義xml文件

3. 主要Java邏輯代碼如下。
|
1
2
3
4
5
6
7
8
9
10
11
12
13
14
15
16
17
18
19
20
21
22
23
24
25
26
27
28
29
30
31
32
33
34
35
36
37
38
39
40
41
42
43
44
45
46
47
48
49
50
51
52
53
54
55
56
57
58
59
60
61
62
63
64
65
66
67
68
69
70
71
72
73
74
75
76
77
78
79
80
81
82
83
84
85
86
87
88
89
90
91
92
93
94
95
96
97
98
|
importjava.util.ArrayList; importcom.github.mikephil.charting.charts.PieChart; importcom.github.mikephil.charting.components.Legend; importcom.github.mikephil.charting.components.Legend.LegendPosition; importcom.github.mikephil.charting.data.Entry; importcom.github.mikephil.charting.data.PieData; importcom.github.mikephil.charting.data.PieDataSet; import android.support.v7.app.ActionBarActivity; importandroid.graphics.Color; importandroid.os.Bundle; importandroid.util.DisplayMetrics; public class MainActivity extends ActionBarActivity { privatePieChartmChart; @Overrideprotected void onCreate(Bundle savedInstanceState) { super.onCreate(savedInstanceState); setContentView(R.layout.activity_main); mChart = (PieChart) findViewById(R.id.spread_pie_chart); PieDatamPieData = getPieData(4, 100); showChart(mChart, mPieData); } private void showChart(PieChartpieChart, PieDatapieData) { pieChart.setHoleColorTransparent(true); pieChart.setHoleRadius(60f); //半徑pieChart.setTransparentCircleRadius(64f); // 半透明圈//pieChart.setHoleRadius(0) //實心圓pieChart.setDescription("測試餅狀圖"); // mChart.setDrawYValues(true); pieChart.setDrawCenterText(true); //餅狀圖中間可以添加文字pieChart.setDrawHoleEnabled(true); pieChart.setRotationAngle(90); // 初始旋轉(zhuǎn)角度// draws the corresponding description value into the slice // mChart.setDrawXValues(true); // enable rotation of the chart by touch pieChart.setRotationEnabled(true); // 可以手動旋轉(zhuǎn)// display percentage values pieChart.setUsePercentValues(true); //顯示成百分比// mChart.setUnit(" €"); // mChart.setDrawUnitsInChart(true); // add a selection listener // mChart.setOnChartValueSelectedListener(this); // mChart.setTouchEnabled(false); // mChart.setOnAnimationListener(this); pieChart.setCenterText("Quarterly Revenue"); //餅狀圖中間的文字//設(shè)置數(shù)據(jù)pieChart.setData(pieData); // undo all highlights // pieChart.highlightValues(null); // pieChart.invalidate(); Legend mLegend = pieChart.getLegend(); //設(shè)置比例圖mLegend.setPosition(LegendPosition.RIGHT_OF_CHART); //最右邊顯示// mLegend.setForm(LegendForm.LINE); //設(shè)置比例圖的形狀,默認是方形mLegend.setXEntrySpace(7f); mLegend.setYEntrySpace(5f); pieChart.animateXY(1000, 1000); //設(shè)置動畫// mChart.spin(2000, 0, 360); } /** * * @param count 分成幾部分* @param range */privatePieDatagetPieData(int count, float range) { ArrayList<String>xValues = new ArrayList<String>(); //xVals用來表示每個餅塊上的內(nèi)容for (inti = 0; i< count; i++) { xValues.add("Quarterly" + (i + 1)); //餅塊上顯示成Quarterly1, Quarterly2, Quarterly3, Quarterly4 } ArrayList<Entry>yValues = new ArrayList<Entry>(); //yVals用來表示封裝每個餅塊的實際數(shù)據(jù)// 餅圖數(shù)據(jù)/** * 將一個餅形圖分成四部分,四部分的數(shù)值比例為14:14:34:38 * 所以 14代表的百分比就是14% */float quarterly1 = 14; float quarterly2 = 14; float quarterly3 = 34; float quarterly4 = 38; yValues.add(new Entry(quarterly1, 0)); yValues.add(new Entry(quarterly2, 1)); yValues.add(new Entry(quarterly3, 2)); yValues.add(new Entry(quarterly4, 3)); //y軸的集合PieDataSetpieDataSet = new PieDataSet(yValues, "Quarterly Revenue 2014"/*顯示在比例圖上*/); pieDataSet.setSliceSpace(0f); //設(shè)置個餅狀圖之間的距離ArrayList<Integer> colors = new ArrayList<Integer>(); // 餅圖顏色colors.add(Color.rgb(205, 205, 205)); colors.add(Color.rgb(114, 188, 223)); colors.add(Color.rgb(255, 123, 124)); colors.add(Color.rgb(57, 135, 200)); pieDataSet.setColors(colors); DisplayMetrics metrics = getResources().getDisplayMetrics(); floatpx = 5 * (metrics.densityDpi / 160f); pieDataSet.setSelectionShift(px); // 選中態(tài)多出的長度PieDatapieData = new PieData(xValues, pieDataSet); returnpieData; } } |
效果圖如下:

MPAndroidChart開源圖表庫之折線圖
1. 將mpandroidchartlibrary-2-0-8.jar包copy到項目的libs中
2. 定義xml文件

3. 主要Java邏輯代碼如下。
|
1
2
3
4
5
6
7
8
9
10
11
12
13
14
15
16
17
18
19
20
21
22
23
24
25
26
27
28
29
30
31
32
33
34
35
36
37
38
39
40
41
42
43
44
45
46
47
48
49
50
51
52
53
54
55
56
57
58
59
60
61
62
63
64
65
66
67
68
69
70
71
72
73
74
75
76
77
78
79
80
81
82
83
84
85
86
87
88
89
|
packagecom.example.mpandroidlinechart; importjava.util.ArrayList; importcom.github.mikephil.charting.charts.LineChart; importcom.github.mikephil.charting.components.Legend; importcom.github.mikephil.charting.components.Legend.LegendForm; importcom.github.mikephil.charting.data.Entry; importcom.github.mikephil.charting.data.LineData; importcom.github.mikephil.charting.data.LineDataSet; import android.support.v7.app.ActionBarActivity; importandroid.graphics.Color; importandroid.os.Bundle; public class MainActivity extends ActionBarActivity { privateLineChartmLineChart; // private Typeface mTf; @Overrideprotected void onCreate(Bundle savedInstanceState) { super.onCreate(savedInstanceState); setContentView(R.layout.activity_main); mLineChart = (LineChart) findViewById(R.id.spread_line_chart); // mTf = Typeface.createFromAsset(getAssets(), "OpenSans-Bold.ttf"); LineDatamLineData = getLineData(36, 100); showChart(mLineChart, mLineData, Color.rgb(114, 188, 223)); } // 設(shè)置顯示的樣式private void showChart(LineChartlineChart, LineDatalineData, int color) { lineChart.setDrawBorders(false); //是否在折線圖上添加邊框// no description text lineChart.setDescription("");// 數(shù)據(jù)描述// 如果沒有數(shù)據(jù)的時候,會顯示這個,類似listview的emtpyviewlineChart.setNoDataTextDescription("You need to provide data for the chart."); // enable / disable grid background lineChart.setDrawGridBackground(false); // 是否顯示表格顏色lineChart.setGridBackgroundColor(Color.WHITE& 0x70FFFFFF); // 表格的的顏色,在這里是是給顏色設(shè)置一個透明度// enable touch gestures lineChart.setTouchEnabled(true); // 設(shè)置是否可以觸摸// enable scaling and dragging lineChart.setDragEnabled(true);// 是否可以拖拽lineChart.setScaleEnabled(true);// 是否可以縮放// if disabled, scaling can be done on x- and y-axis separately lineChart.setPinchZoom(false);// lineChart.setBackgroundColor(color);// 設(shè)置背景// add data lineChart.setData(lineData); // 設(shè)置數(shù)據(jù)// get the legend (only possible after setting data) Legend mLegend = lineChart.getLegend(); // 設(shè)置比例圖標示,就是那個一組y的value的// modify the legend ...// mLegend.setPosition(LegendPosition.LEFT_OF_CHART); mLegend.setForm(LegendForm.CIRCLE);// 樣式mLegend.setFormSize(6f);// 字體mLegend.setTextColor(Color.WHITE);// 顏色// mLegend.setTypeface(mTf);// 字體lineChart.animateX(2500); // 立即執(zhí)行的動畫,x軸} /** * 生成一個數(shù)據(jù)* @param count 表示圖表中有多少個坐標點* @param range 用來生成range以內(nèi)的隨機數(shù)* @return */privateLineDatagetLineData(int count, float range) { ArrayList<String>xValues = new ArrayList<String>(); for (inti = 0; i< count; i++) { // x軸顯示的數(shù)據(jù),這里默認使用數(shù)字下標顯示xValues.add("" + i); } // y軸的數(shù)據(jù)ArrayList<Entry>yValues = new ArrayList<Entry>(); for (inti = 0; i< count; i++) { float value = (float) (Math.random() * range) + 3; yValues.add(new Entry(value, i)); } // create a dataset and give it a type // y軸的數(shù)據(jù)集合LineDataSetlineDataSet = new LineDataSet(yValues, "測試折線圖" /*顯示在比例圖上*/); // mLineDataSet.setFillAlpha(110); // mLineDataSet.setFillColor(Color.RED); //用y軸的集合來設(shè)置參數(shù)lineDataSet.setLineWidth(1.75f); // 線寬lineDataSet.setCircleSize(3f);// 顯示的圓形大小lineDataSet.setColor(Color.WHITE);// 顯示顏色lineDataSet.setCircleColor(Color.WHITE);// 圓形的顏色lineDataSet.setHighLightColor(Color.WHITE); // 高亮的線的顏色ArrayList<LineDataSet>lineDataSets = new ArrayList<LineDataSet>(); lineDataSets.add(lineDataSet); // add the datasets // create a data object with the datasets LineDatalineData = new LineData(xValues, lineDataSets); returnlineData; } } |
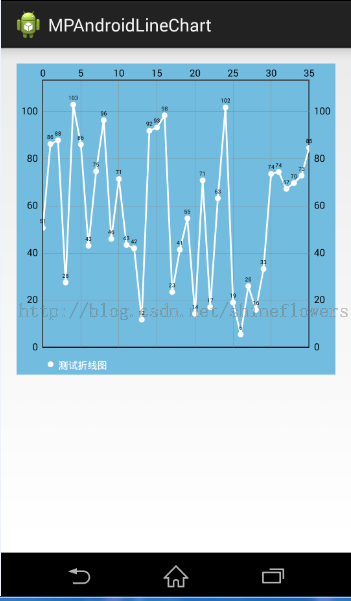
效果圖如下:

MPAndroidChart開源圖表庫之柱狀圖
1. 將mpandroidchartlibrary-2-0-8.jar包copy到項目的libs中
2. 定義xml文件

3. 主要Java邏輯代碼如下。
|
1
2
3
4
5
6
7
8
9
10
11
12
13
14
15
16
17
18
19
20
21
22
23
24
25
26
27
28
29
30
31
32
33
34
35
36
37
38
39
40
41
42
43
44
45
46
47
48
49
50
51
52
53
54
55
56
57
58
59
60
61
62
63
64
65
66
67
68
69
70
71
72
73
74
75
76
77
78
79
80
81
82
83
84
85
86
87
88
89
90
91
92
93
94
95
96
97
98
99
100
101
102
103
104
105
106
107
108
109
110
111
112
113
114
115
116
117
118
119
120
121
122
123
124
125
126
127
128
129
130
131
132
133
134
135
|
packagecom.jackie.mpandoidbarchart;importjava.util.ArrayList;importcom.github.mikephil.charting.charts.BarChart;importcom.github.mikephil.charting.charts.LineChart;importcom.github.mikephil.charting.components.Legend;importcom.github.mikephil.charting.components.Legend.LegendForm;importcom.github.mikephil.charting.components.XAxis;importcom.github.mikephil.charting.components.XAxis.XAxisPosition;importcom.github.mikephil.charting.data.BarData;importcom.github.mikephil.charting.data.BarDataSet;importcom.github.mikephil.charting.data.BarEntry;import android.support.v7.app.ActionBarActivity;importandroid.graphics.Color;importandroid.os.Bundle;public class MainActivity extends ActionBarActivity {privateBarChartmBarChart;privateBarDatamBarData;@Overrideprotected void onCreate(Bundle savedInstanceState) {super.onCreate(savedInstanceState);setContentView(R.layout.activity_main);mBarChart = (BarChart) findViewById(R.id.spread_bar_chart);mBarData = getBarData(4, 100);showBarChart(mBarChart, mBarData);}private void showBarChart(BarChartbarChart, BarDatabarData) {barChart.setDrawBorders(false); ////是否在折線圖上添加邊框barChart.setDescription("");// 數(shù)據(jù)描述// 如果沒有數(shù)據(jù)的時候,會顯示這個,類似ListView的EmptyViewbarChart.setNoDataTextDescription("You need to provide data for the chart."); barChart.setDrawGridBackground(false); // 是否顯示表格顏色barChart.setGridBackgroundColor(Color.WHITE& 0x70FFFFFF); // 表格的的顏色,在這里是是給顏色設(shè)置一個透明度barChart.setTouchEnabled(true); // 設(shè)置是否可以觸摸barChart.setDragEnabled(true);// 是否可以拖拽barChart.setScaleEnabled(true);// 是否可以縮放barChart.setPinchZoom(false);// // barChart.setBackgroundColor();// 設(shè)置背景barChart.setDrawBarShadow(true);barChart.setData(barData); // 設(shè)置數(shù)據(jù)Legend mLegend = barChart.getLegend(); // 設(shè)置比例圖標示mLegend.setForm(LegendForm.CIRCLE);// 樣式mLegend.setFormSize(6f);// 字體mLegend.setTextColor(Color.BLACK);// 顏色// X軸設(shè)定// XAxisxAxis = barChart.getXAxis();// xAxis.setPosition(XAxisPosition.BOTTOM);barChart.animateX(2500); // 立即執(zhí)行的動畫,x軸 }privateBarDatagetBarData(int count, float range) {ArrayList<String>xValues = new ArrayList<String>();for (inti = 0; i< count; i++) {xValues.add("第" + (i + 1) + "季度");}ArrayList<BarEntry>yValues = new ArrayList<BarEntry>();for (inti = 0; i< count; i++) { float value = (float) (Math.random() * range/*100以內(nèi)的隨機數(shù)*/) + 3;yValues.add(new BarEntry(value, i)); }// y軸的數(shù)據(jù)集合BarDataSetbarDataSet = new BarDataSet(yValues, "測試餅狀圖"); barDataSet.setColor(Color.rgb(114, 188, 223));ArrayList<BarDataSet>barDataSets = new ArrayList<BarDataSet>(); barDataSets.add(barDataSet); // add the datasets BarDatabarData = new BarData(xValues, barDataSets);returnbarData;}}packagecom.jackie.mpandoidbarchart;importjava.util.ArrayList;importcom.github.mikephil.charting.charts.BarChart;importcom.github.mikephil.charting.charts.LineChart;importcom.github.mikephil.charting.components.Legend;importcom.github.mikephil.charting.components.Legend.LegendForm;importcom.github.mikephil.charting.components.XAxis;importcom.github.mikephil.charting.components.XAxis.XAxisPosition;importcom.github.mikephil.charting.data.BarData;importcom.github.mikephil.charting.data.BarDataSet;importcom.github.mikephil.charting.data.BarEntry;import android.support.v7.app.ActionBarActivity;importandroid.graphics.Color;importandroid.os.Bundle;public class MainActivity extends ActionBarActivity {privateBarChartmBarChart;privateBarDatamBarData;@Overrideprotected void onCreate(Bundle savedInstanceState) {super.onCreate(savedInstanceState);setContentView(R.layout.activity_main);mBarChart = (BarChart) findViewById(R.id.spread_bar_chart);mBarData = getBarData(4, 100);showBarChart(mBarChart, mBarData);}private void showBarChart(BarChartbarChart, BarDatabarData) {barChart.setDrawBorders(false); ////是否在折線圖上添加邊框barChart.setDescription("");// 數(shù)據(jù)描述// 如果沒有數(shù)據(jù)的時候,會顯示這個,類似ListView的EmptyViewbarChart.setNoDataTextDescription("You need to provide data for the chart."); barChart.setDrawGridBackground(false); // 是否顯示表格顏色barChart.setGridBackgroundColor(Color.WHITE& 0x70FFFFFF); // 表格的的顏色,在這里是是給顏色設(shè)置一個透明度barChart.setTouchEnabled(true); // 設(shè)置是否可以觸摸barChart.setDragEnabled(true);// 是否可以拖拽barChart.setScaleEnabled(true);// 是否可以縮放barChart.setPinchZoom(false);// // barChart.setBackgroundColor();// 設(shè)置背景barChart.setDrawBarShadow(true);barChart.setData(barData); // 設(shè)置數(shù)據(jù)Legend mLegend = barChart.getLegend(); // 設(shè)置比例圖標示mLegend.setForm(LegendForm.CIRCLE);// 樣式mLegend.setFormSize(6f);// 字體mLegend.setTextColor(Color.BLACK);// 顏色// X軸設(shè)定// XAxisxAxis = barChart.getXAxis();// xAxis.setPosition(XAxisPosition.BOTTOM);barChart.animateX(2500); // 立即執(zhí)行的動畫,x軸 }privateBarDatagetBarData(int count, float range) {ArrayList<String>xValues = new ArrayList<String>();for (inti = 0; i< count; i++) {xValues.add("第" + (i + 1) + "季度");}ArrayList<BarEntry>yValues = new ArrayList<BarEntry>();for (inti = 0; i< count; i++) { float value = (float) (Math.random() * range/*100以內(nèi)的隨機數(shù)*/) + 3;yValues.add(new BarEntry(value, i)); }// y軸的數(shù)據(jù)集合BarDataSetbarDataSet = new BarDataSet(yValues, "測試餅狀圖"); barDataSet.setColor(Color.rgb(114, 188, 223));ArrayList<BarDataSet>barDataSets = new ArrayList<BarDataSet>(); barDataSets.add(barDataSet); // add the datasets BarDatabarData = new BarData(xValues, barDataSets);returnbarData;}} |
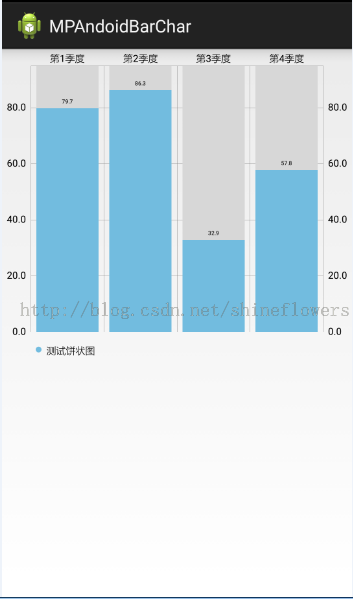
效果圖如下:

以上所述是小編給大家介紹的MPAndroidChart開源圖表庫的使用介紹之餅狀圖、折線圖和柱狀圖的相關(guān)知識,希望對大家有所幫助。


